
-
-
-
Market holds steady as high mortgage rate persists
Published on:
Northwest Multiple Listing Service (NWMLS), the source for the most current, accurate market listing data in Washington state, today released its Market Snapshot for July 2025.
Market Recap
At the end of July 2025, the 30-year fixed mortgage rate was 6.72%, virtually the same as the average rate over the past year. As a consequence, home sales remain sluggish with only a 3.81% increase in transactions over July 2024. The growth in listings relative to a year earlier was much greater at 37.42%. Meanwhile, median prices remained consistent with July 2024 prices.
July 2025 Key Takeaways
Active Listings
- There was a 37.42% increase in total number of properties listed for sale year-over-year, with 20,781 active listings on the market at the end of July 2025, compared to 15,122 at the end of July 2024. When compared to the previous month, active inventory increased by 944 listings (+4.76%), up from 19,837 in June 2025.
- The number of homes for sale year-over-year increased throughout the NWMLS coverage area, with 26 out of 27 counties seeing a double-digit year-over-year increase (all counties except Okanogan, which increased by 8.7%). The six counties with highest year-over-year increases in active inventory for sale were Ferry (+60%), Snohomish (+53.56%), Clallam (+52.91%), Columbia (+52.17%), Thurston (+46.86%), and Grant (+44.51%).
New Listings
- NWMLS brokers added 10,418 new listings to the database in July 2025, a year-over-year increase of 12.25% compared to July 2024 (9,281). When compared to the previous month (June 2025), new listings decreased by 4.99%, when 10,965 listings were added to the NWMLS database.
- The number of new listings increased year-over-year in 23 of 27 counties. The six counties with the largest year-over-year increases were Clallam (+55.96%), Ferry (+50%), Island (+27.27%), Jefferson (+26.56%), Thurston (+26.25%), and Lewis (+26.02%).
Closed Sales
- The number of closed sales increased by 3.81% year-over-year (6,867 in July 2025 compared to 6,615 in July 2024). When compared to the previous month, the number of closed sales increased by 2.58%, up from 6,694 sales in June 2025.
- 19 out of 27 counties saw an increase in the number of closed sales year-over-year. The six counties with the largest increases were San Juan (+100%), Adams (+75%), Pacific (+71.43%), Ferry (+66.67%), Clallam (+47.56%), and Grant (+30%). The total dollar value of closed sales in July 2025 for residential homes was $5,174,046,115 and was $517,348,303 for condominiums ($5,691,394,418 in total).
Median Sales Price and Total Dollar Value
- The median sales price for residential homes and condominiums sold in July 2025 was $650,000 — unchanged from July 2024. Compared to the previous month, the median price declined 2.99%, down from $670,000 in June 2025.
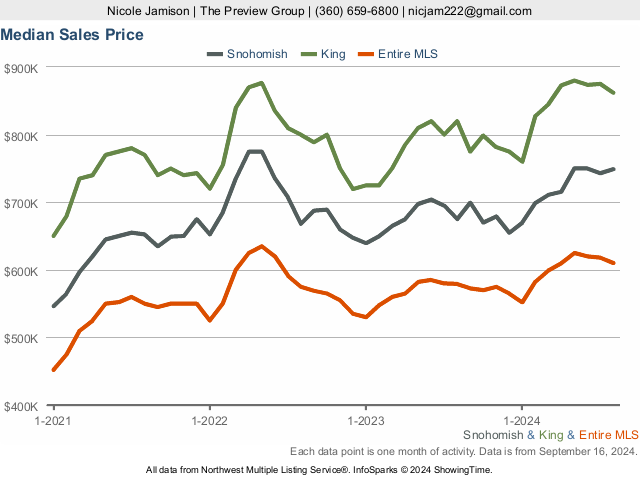
- The three counties with the highest median sale prices were San Juan ($906,250), King ($875,000), and Snohomish ($765,000), and the three counties with the lowest median sale prices were Columbia ($257,250), Ferry ($275,000), and Adams ($349,999).
“As expected, the Federal Open Market Committee of the Federal Reserve Bank kept the federal funds rate unchanged at its July 30 meeting, reflecting ongoing concerns about inflation,” said Steven Bourassa, Director of the Washington Center for Real Estate Research at the University of Washington. “Although the federal funds rate is not directly related to mortgage rates, this decision does suggest that there is unlikely to be any improvement in mortgage rates in the near future.”
Consumer and Broker Activity
NWMLS also provided insights into consumer activities during the month of July 2025:
- Keyboxes located at listed properties were accessed 168,801 times in July 2025, a 1.6% decrease from June 2025 when they were accessed 171,595 times. Keybox activity increased year-over-year by 8%, with keyboxes being accessed 156,268 times in July 2024.
- The total number of property showings scheduled through NWMLS-provided software increased 2.2% from 123,541 in June 2025 to 126,250 in July 2025. This was a year-over-year increase of 7.6% from the number of showings in July 2024 (117,298).
- In July 2025, there were 21,687 listed properties that were eligible for the Down Payment Resource program offered by NWMLS, an 8.8% increase from 19,942 in June 2025. This was a 23.8% year-over-year increase from 17,515 eligible listings in July 2024. 71.7% of listings in the NWMLS database were eligible for down payment program
-
-
